HDPE Pipe Flow Rate Chart: Engineering Sizing Guide
The stormwater system looked correct on paper. Then the first major rainfall hit, and water backed up two city blocks. Maria Santos, the municipal engineer who specified the line, had used a generic pipe sizing table without accounting for the actual hydraulic capacity of HDPE at that diameter and slope. Within a week, the municipality was reviewing plans for a larger replacement pipe.
If you design or procure municipal drainage, stormwater, or sewer infrastructure, you have probably faced the same pressure: select a pipe diameter that handles peak flow without oversizing the budget. An HDPE pipe flow rate chart is one of the fastest tools for estimating capacity, but it only works when you understand what the numbers mean and what assumptions sit behind them.
In this guide, you will learn how to read an HDPE pipe flow rate chart, what factors affect flow capacity, how to verify numbers with basic hydraulic calculations, and where common sizing errors occur. We have based this on standard hydraulic engineering practice and Yongke Machinery's 16+ years of supporting large-diameter HDPE and PP pipe production worldwide.
Why HDPE Pipe Flow Rate Matters for Large-Diameter Infrastructure
Flow rate determines whether a drainage or sewer system performs as designed. Undersize the pipe, and you risk surcharge, flooding, or structural overload. Oversize it, and you pay for material, excavation, and installation you do not need. For large-diameter projects, the cost difference between DN1200mm and DN1500mm can be substantial, so precision matters.
HDPE pipe is widely used in municipal infrastructure because it offers a smooth interior surface, corrosion resistance, and structural flexibility. These properties translate directly into hydraulic performance. A smooth wall reduces friction loss, which means the same diameter HDPE pipe can often carry more flow than concrete or corrugated metal alternatives at the same slope.
Municipal engineers use HDPE pipe flow rate charts at multiple project stages: preliminary feasibility, detailed design, value engineering, and procurement. Contractors also rely on them when checking whether an existing pipe specification matches real-world discharge requirements.
Need pipe production capacity for your next project? Learn about Yongke's DN300–DN5000mm HDPE spiral profile pipe machines.
Engineering Note: Always confirm flow rate estimates with project-specific hydraulic modeling. Charts provide a starting point; final design should reference local design standards, expected peak flows, and safety factors.
What Affects HDPE Pipe Flow Rate?
A flow rate chart is not universal. The same DN800mm HDPE pipe can deliver very different capacities depending on slope, roughness, fill level, and fluid temperature. Before using any chart, understand the variables that drive the numbers.
Pipe Diameter and Cross-Sectional Area
Flow capacity increases rapidly with diameter. Because area scales with the square of the diameter, doubling the pipe diameter roughly quadruples the cross-sectional area. In gravity systems, this non-linear relationship makes diameter selection the most powerful lever for increasing capacity.
Interior Surface Roughness
HDPE has a low Manning's roughness coefficient, typically between 0.009 and 0.012 for smooth-wall polyethylene pipe. By comparison, concrete pipe often uses n = 0.013, and corrugated metal pipe can range from n = 0.022 to 0.030. The lower the n value, the higher the flow capacity at the same slope and diameter.
Pipe Slope or Hydraulic Gradient
Gravity flow depends on slope. A steeper gradient increases velocity and discharge. Most charts assume a specific slope, so comparing capacities at different gradients requires recalculation or a multi-slope chart.
Flow Depth: Full vs Partial
Many charts assume full-pipe flow. In gravity sewers and storm drains, pipes rarely run full under normal conditions. Designing for partial flow changes both the cross-sectional area and the hydraulic radius, so the actual capacity at design flow may differ from a full-flow chart value.
Temperature and Fluid Properties
HDPE pipe dimensions and material behavior change slightly with temperature. For water and wastewater applications within normal operating ranges, temperature effects on flow capacity are usually small compared with diameter and slope effects. They become more significant in pressurized systems or extreme climates.
HDPE Pipe Flow Rate Chart by Diameter
The chart below provides estimated full-flow capacity for smooth-wall HDPE pipe using Manning's equation with n = 0.010. Values are shown for two common slopes: 0.5% and 1.0%. Use these figures for preliminary sizing and feasibility checks.
| Nominal Diameter (DN) | Internal Diameter (mm) | Flow at 0.5% Slope (m³/h) | Flow at 1.0% Slope (m³/h) |
|---|---|---|---|
| DN300 | 300 | 320 | 450 |
| DN400 | 400 | 690 | 970 |
| DN500 | 500 | 1,250 | 1,770 |
| DN600 | 600 | 2,020 | 2,860 |
| DN800 | 800 | 4,380 | 6,200 |
| DN1000 | 1,000 | 7,940 | 11,230 |
| DN1200 | 1,200 | 12,900 | 18,250 |
| DN1500 | 1,500 | 23,400 | 33,100 |
| DN2000 | 2,000 | 50,400 | 71,300 |
| DN2500 | 2,500 | 91,500 | 129,400 |
| DN3000 | 3,000 | 148,500 | 210,000 |
| DN4000 | 4,000 | 319,800 | 452,200 |
| DN5000 | 5,000 | 576,700 | 815,400 |
These values assume circular pipe flowing full, uniform slope, clean interior surface, and no obstructions. For partial flow or systems with bends, junctions, and appurtenances, apply appropriate hydraulic corrections. For detailed design guidance, the Plastics Pipe Institute Handbook of PE Pipe provides technical references on polyethylene hydraulic design.
For large-diameter infrastructure, the jump from DN2000mm to DN3000mm more than doubles capacity at the same slope. This is why selecting the right diameter early in design has such a strong impact on both performance and cost.
How to Calculate HDPE Pipe Flow Rate
Engineers commonly use two methods to verify pipe capacity: the Manning equation for gravity flow and the Hazen-Williams equation for pressurized flow.
Manning Equation for Gravity Flow
The Manning equation is the standard approach for open-channel and gravity pipe flow:
Q = (1/n) × A × R^(2/3) × S^(1/2)
Where:
Q = flow rate (m³/s)
n = Manning's roughness coefficient
A = cross-sectional area of flow (m²)
R = hydraulic radius (m), equal to A divided by wetted perimeter
S = slope of the energy grade line (m/m)
For a circular pipe flowing full:
A = πD²/4
R = D/4
If you know the target flow and slope, you can rearrange the equation to solve for required diameter. This is how designers check whether a chart value matches project requirements.
Hazen-Williams Equation for Pressurized Flow
For pressurized water distribution systems, the Hazen-Williams equation is often used:
Q = 0.2785 × C × D^2.63 × S^0.54
Where:
Q = flow rate (m³/s)
C = Hazen-Williams roughness coefficient
D = pipe internal diameter (m)
S = hydraulic gradient (m/m)
For HDPE pipe, C values typically range from 140 to 150, reflecting the smooth interior surface. Always use the coefficient recommended by your design code or pipe manufacturer. The AWWA M55 manual on PE pipe design and installation is a widely referenced authority for pressurized polyethylene systems.
Partial Flow Considerations
Gravity sewers and storm drains usually operate at partial depth. Use the hydraulic elements graph for circular pipe to relate partial-flow depth to velocity and discharge. At approximately 94% of full depth, a circular pipe reaches its maximum discharge because the hydraulic radius begins to decrease relative to the wetted area.
Want to see how these diameters fit your project? Explore our DN300–DN5000mm HDPE spiral profile pipe production line for large-diameter pipe manufacturing.
Common Mistakes When Using Flow Rate Charts
Even a well-constructed HDPE pipe flow rate chart can be misapplied. Here are the most frequent errors engineers and procurement managers encounter.
Assuming All Charts Use the Same Roughness
A chart based on n = 0.009 will show higher capacity than one based on n = 0.012. Always check the Manning's n assumption before comparing values. For used or internally lined pipe, the effective roughness may be higher than the new-pipe value.
Ignoring Fittings, Bends, and Junctions
Charts give straight-pipe capacity. Every bend, manhole, reducer, and tee adds local head loss. In large-diameter networks, these losses can materially reduce system capacity, especially at high velocities.
Designing for Full Flow in Gravity Systems
A storm sewer running full is already in surcharge. Good practice designs for partial flow, typically 50% to 75% of full depth for peak events, leaving capacity for debris, sediment, and future loading.
Forgetting Velocity Limits
Minimum velocity prevents sediment deposition; maximum velocity prevents erosion and scour. Typical design ranges are 0.6 m/s to 3.0 m/s for gravity sewers. Flow capacity alone does not guarantee a healthy system.
David Okonkwo, a project engineer working on a suburban sewer extension, learned this the hard way. His team sized a DN600mm HDPE line to handle peak wet-weather flow at a steep 2% slope. The capacity was more than adequate, but during dry-weather flow the velocity dropped below 0.5 m/s.
Sediment settled in the low-flow periods, and within 18 months the line required jet cleaning. The project eventually added a parallel relief sewer to maintain self-cleansing velocity. Capacity without velocity control created an operational problem.
Selecting Diameter Before Confirming Slope
Slope and diameter are interdependent. A flat site may require a larger diameter to achieve the same capacity that a smaller pipe could deliver on a steeper grade. Always develop slope and diameter together during route planning.
HDPE Pipe Flow Rate vs Other Pipe Materials
One reason HDPE is specified for large-diameter drainage is its superior hydraulic efficiency. The smooth interior surface reduces friction, which translates into higher capacity or smaller required diameter compared with alternative materials.
| Pipe Material | Typical Manning's n | Relative Flow Capacity at Same Diameter and Slope |
|---|---|---|
| HDPE (smooth wall) | 0.009–0.012 | Highest |
| Reinforced concrete | 0.013 | Approximately 85–90% of HDPE |
| Ductile iron | 0.012–0.015 | Approximately 80–90% of HDPE |
| Corrugated metal | 0.022–0.030 | Approximately 40–55% of HDPE |
This efficiency advantage means a DN1000mm HDPE pipe may deliver a similar capacity to a DN1200mm concrete pipe in some conditions. For long pipeline projects, the downstream cost savings in material, transportation, and excavation can be significant.
At Yongke Machinery, we manufacture HDPE/PP spiral profile pipe machines that produce structural wall pipe from DN300mm to DN5000mm. The spiral profile design maintains ring stiffness while delivering the hydraulic benefits of a smooth interior bore.
How to Select the Right HDPE Pipe Diameter for Your Project
A flow rate chart is a starting point, not a final specification. Follow this process to move from chart to procurement-ready design.
Define design flow. Calculate peak flow using rational method, unit hydrograph, or sewer design criteria appropriate to your region. Include allowance for infiltration and inflow where required.
Establish slope constraints. Survey the route and identify minimum and maximum allowable grades. Slope drives velocity and capacity.
Select roughness coefficient. Use n = 0.010 for new smooth-wall HDPE unless project standards or manufacturer data specify otherwise.
Apply partial-flow design. Size the pipe so design flow occupies 50% to 75% of full depth, depending on the design standard.
Check velocity limits. Confirm minimum self-cleansing velocity and maximum allowable velocity for the pipe material and bedding.
Add safety margin. Allow for future development, debris, sediment, and uncertainty in peak flow estimates.
Match to available tooling. If you plan to produce pipe in-house, confirm that your mandrel and production line cover the target diameter range. Yongke's spiral profile pipe machines cover OD200mm to OD5000mm with matched mandrel sets.
Engineering Note: For large-diameter projects, consider producing pipe on-site or in a nearby facility. In-house production with a large-diameter HDPE pipe production line can reduce transportation costs and give you direct control over delivery schedules.
Large-Diameter HDPE Pipe for Municipal and Industrial Applications
Flow rate requirements vary by application. Municipal stormwater systems often need capacity for short-duration peak events, while sanitary sewer systems design for sustained daily and peak flows. Industrial applications may require resistance to aggressive effluents alongside precise hydraulic capacity.
The DN300mm to DN5000mm range covers most large-scale infrastructure needs. DN300mm to DN600mm lines handle local collector drains and small-diameter sewer laterals. DN800mm to DN1500mm pipes serve main storm and sanitary trunk lines. DN2000mm and above are used for major interceptor sewers, outfalls, culverts, and large stormwater retention systems.
When contractors can produce these diameters locally, project logistics become simpler. Transporting a DN4000mm pipe over long distances is expensive and complex. A mobile or fixed spiral profile pipe production line can manufacture pipe at the project site or in a regional yard, cutting logistics cost and delivery risk.
Ahmed Farouk's contracting team faced exactly that problem on a coastal stormwater outfall in 2024. The project required 2.8 kilometers of DN3000mm HDPE pipe, and shipping each 12-meter section from a distant supplier would have tied up the narrow access road for weeks.
Instead, his team set up a spiral pipe production line at a staging yard 15 kilometers from the site. They produced pipe on demand, reduced transport damage, and matched the installation schedule day by day. The local production approach cut logistics cost by an estimated 30% and eliminated the risk of delivery delays during the rainy season.
Ready to discuss your diameter and production requirements? Request a customized quotation from Yongke Machinery's engineering team.
Conclusion
An HDPE pipe flow rate chart is a practical first step in sizing municipal drainage, stormwater, and sewer systems. The key is to use it with the right assumptions: pipe roughness, slope, fill level, and velocity limits all affect whether a chart value matches your project reality.
Key Takeaways
HDPE's smooth interior gives it higher flow capacity than concrete or corrugated metal at the same diameter.
Manning's equation is the standard method for verifying gravity-flow capacity.
Always design for partial flow in gravity systems, not full-pipe conditions.
Slope and diameter must be developed together during route planning.
Large-diameter HDPE pipe can often be produced locally to reduce logistics complexity.
If your project involves DN300mm to DN5000mm pipe, start with a clear flow rate estimate, confirm it with hydraulic calculations, and choose a pipe supplier or production solution that matches your technical and schedule requirements. Contact Yongke Machinery for a technical consultation, machine specifications, or a project-specific quotation.
Recently Posted
-
HDPE Pipe Standards: A Practical Guide for Engineers and Buyers
June 30, 2026A municipal contractor in Southeast Asia once accepted a shipment of HDPE pipe based only on a supplier's diameter claim. Six Read More
 -
Wastewater Collection System Design, Operation, and Renewal
June 30, 2026In late 2021, a coastal city in Southeast Asia discovered that its oldest wastewater collection system had been losing capacity fo Read More
 -
Wastewater Infrastructure Design, Assessment, and Renewal
June 29, 2026In March 2023, a wastewater treatment plant serving 400,000 residents in Southern Europe suffered a cascade failure. A single inte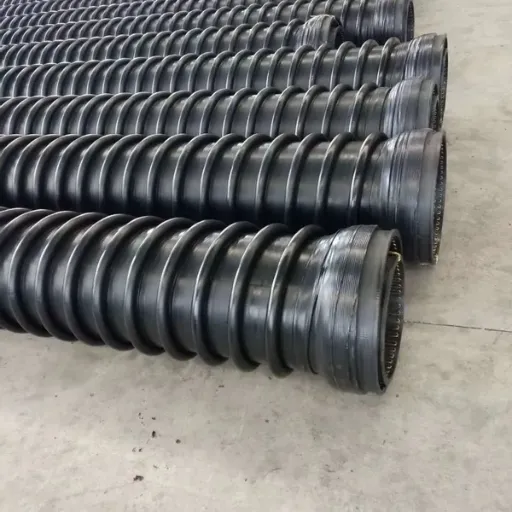 Read More
 -
Combined Sewer System Design, Operation, and Rehabilitation
June 29, 2026In August 2021, a single storm dropped 175mm of rain on a midwestern U.S. city in less than 36 hours. The city's aging combine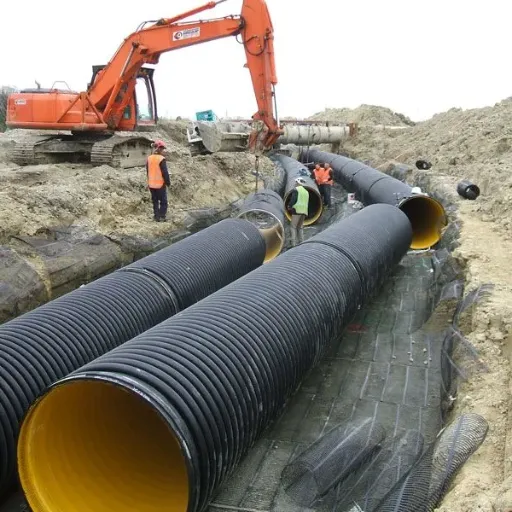 Read More

Contact Us
Recommended Products
-
 CIPP Glass Fibre Liner MachineNegotiableMOQ: 1 Set
 -
HDPE Helically Wound Tank MachineUS$ 10MOQ: 1 Set
-
CIPP Glass Liner MachineNegotiableMOQ: 1 Set
-
CIPP Felt Liner Manufacturing MachineNegotiableMOQ: 1 Set
-
Large Diameter HDPE Sea Intake Outfall Structured Wall Pipe Making MachineNegotiableMOQ: 1 Set
-
UV-CIPP Glass Fibre Liner Manufacturing MachineUS$ 1000 - 110000MOQ: 10 Meters
-
HDPE Pipe Extrusion Machine / PE Pipe Production Line With High OutputNegotiableMOQ: 1 Set
-
UV-CIPP Glass Fiber Liner Hose Production LineUS$ 1000 - 110000MOQ: 1 Set
-
HDPE Spiral Structure Wall Pipe MachineNegotiableMOQ: 1 Set
-
HDPE Spiral Pipe MachineNegotiableMOQ: 1 Set
-
HDPE Spiral Tank MachineNegotiableMOQ: 1 Set
-
Krah Pipe MachineNegotiableMOQ: 1 Set
-
Plastic HDPE PVC PPR Pipe Extrusion Making Machine Extrusion LineNegotiableMOQ: 1 Set
-
PVC Pipe Extrusion Production Line for Electrical Conduit and Water Supply PipesNegotiableMOQ: 1 Set
-
Hot Sell Single Wall Corrugated Pipe Extrusion Line With Competitive PriceNegotiableMOQ: 1 Set
-
HDPE Krah Profild Pipe MachineUS$ 10000MOQ: 1 Set
-
Plastic Tank CNC Holes Boring MachineUS$ 10000MOQ: 1 Set
-
Double Wall Corrugated Pipe Extrusion LineNegotiableMOQ: 1 Set
-
Single Wall Corrugated Pipe Extrusion LineNegotiableMOQ: 1 Set
-
Inversion CIPP Liner Tube Manufacturing MachineNegotiableMOQ: 1 Set